Apply pattern fills to chart data series
Ensure perfect accessibility and help color-blind users read your charts more easily with pattern fill. We’ve added eight different patterns to most of the chart types available.
-
In the upper-right corner, click EDIT.
-
In the right-hand sidebar, click Data Series.
-
In the Series tab, click the series to expand it.
A quicker way to select a series is to click on it directly on the chart.
-
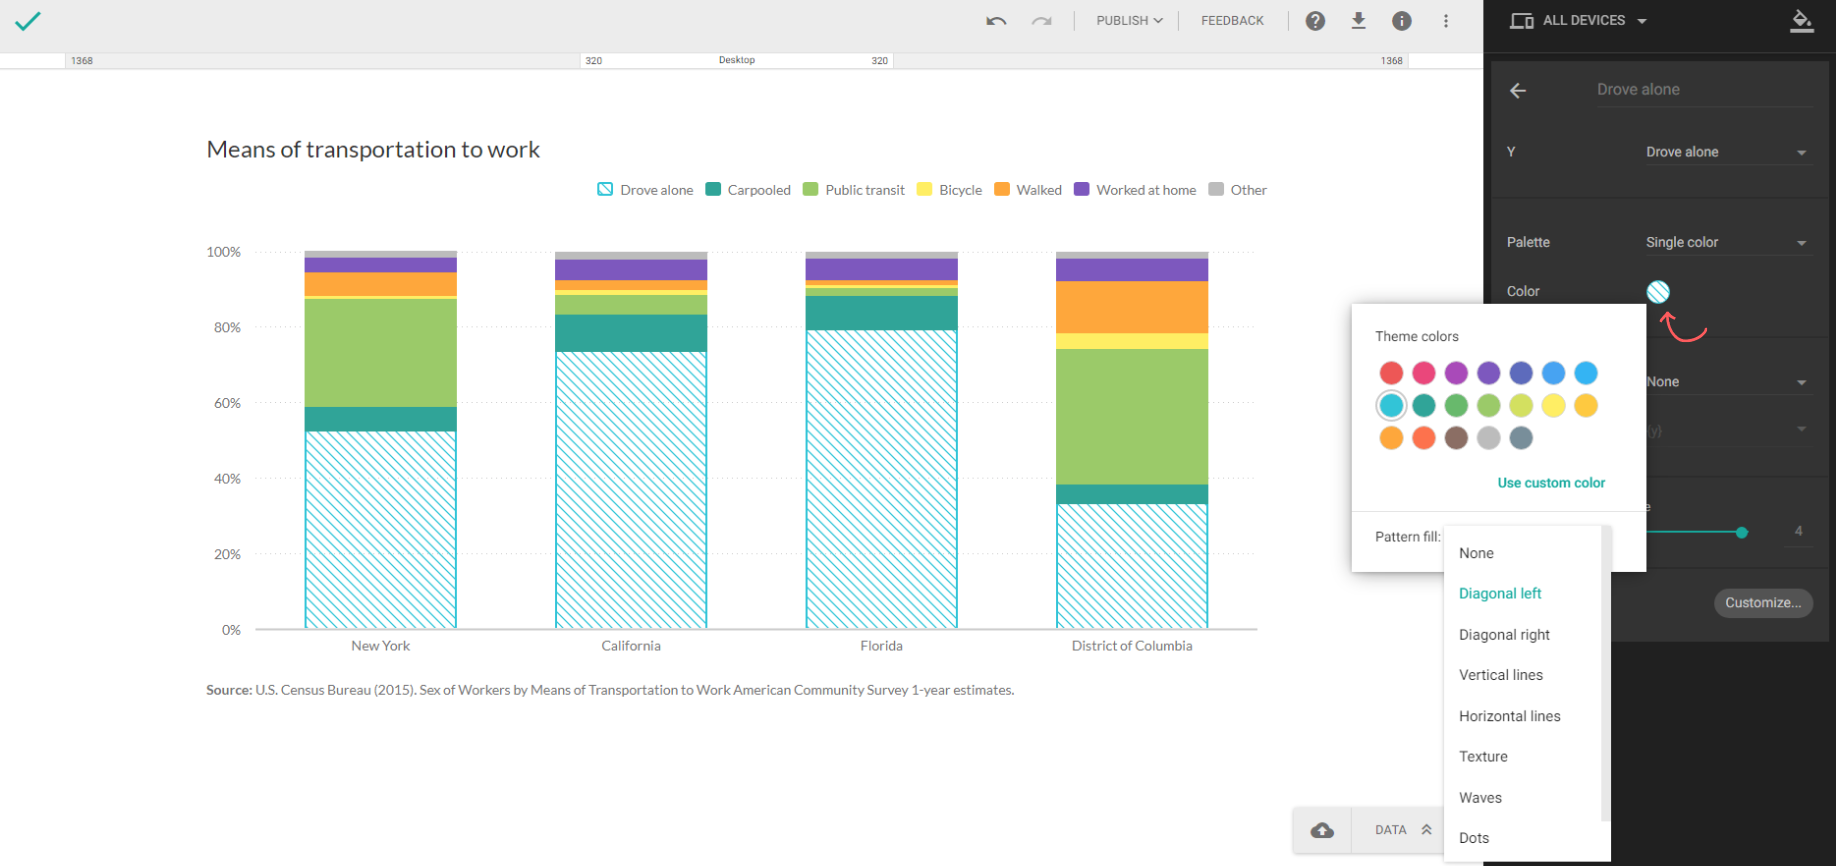
Click Color circle.
-
Choose one of the eight different patterns from the Pattern fill dropdown.
-
Click away to close the color menu.